

This page contains a listing of links that show diagrams of metabolic pathways associated with certain genetic inborn errors of metabolism. It is hoped that this resource page is helpful to physicians in training and to other clinicians caring for patients with the relevant metabolic disorder.
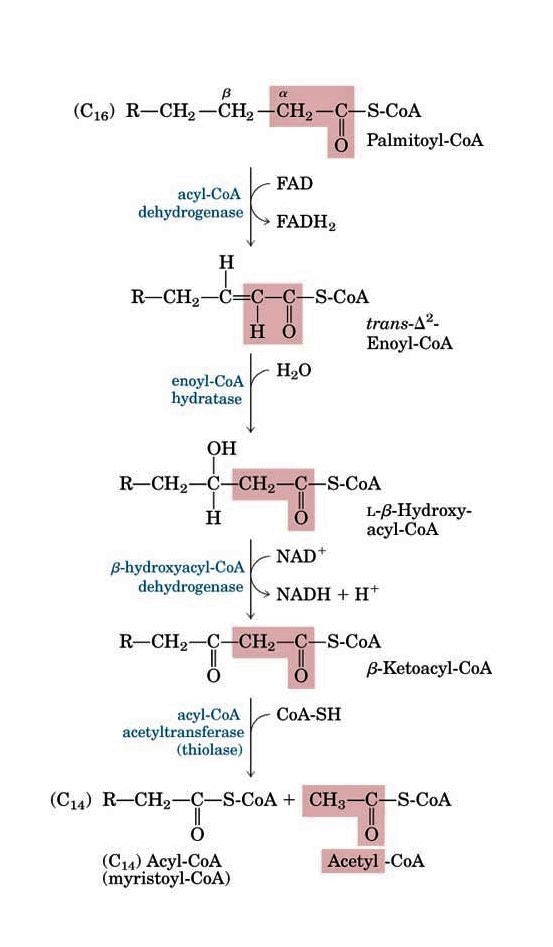
- Acyl-CoA dehydro cycle (VLCAD, MCADD, etc)
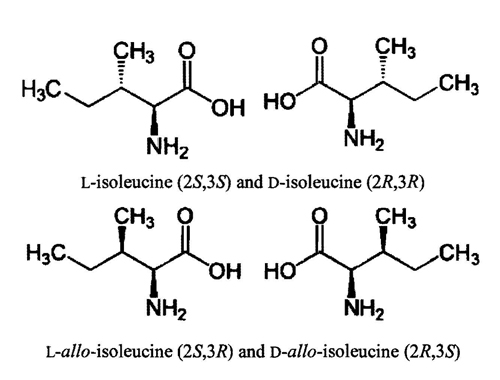
- Alloisoleucine
- Alpha-keto glutarate dehydro complex
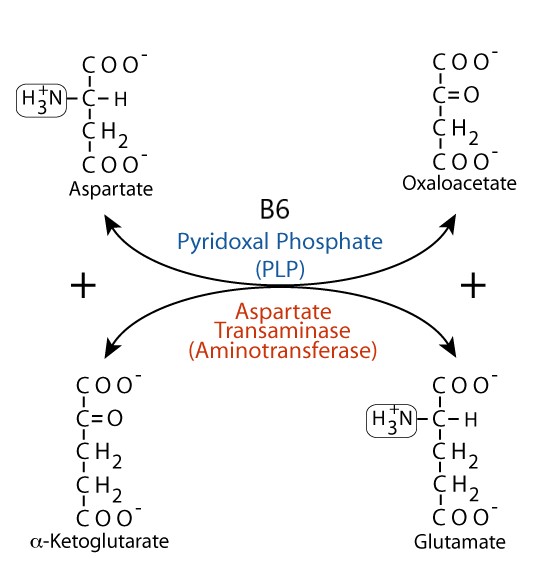
- Aspartate transaminase
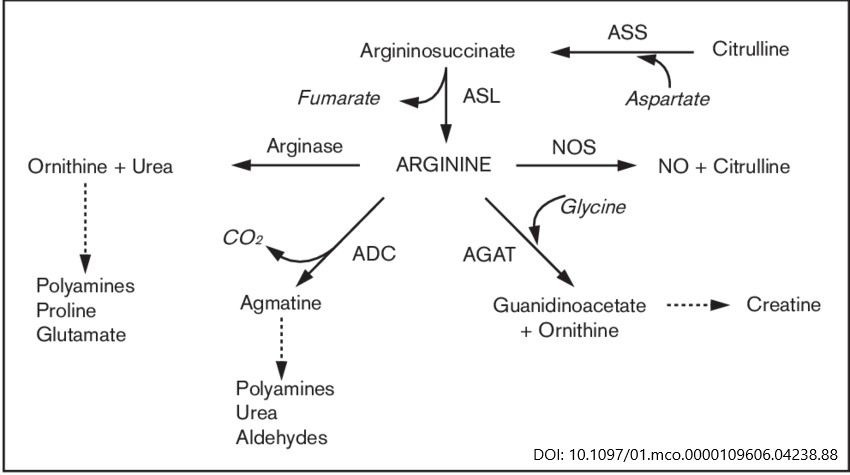
- Arginine metabolism
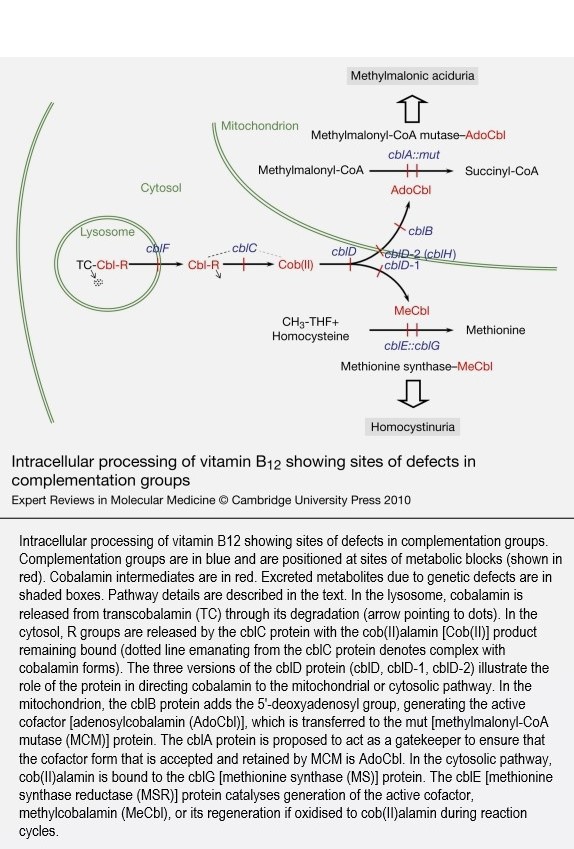
- B12 cobalamin cofactor metabolism
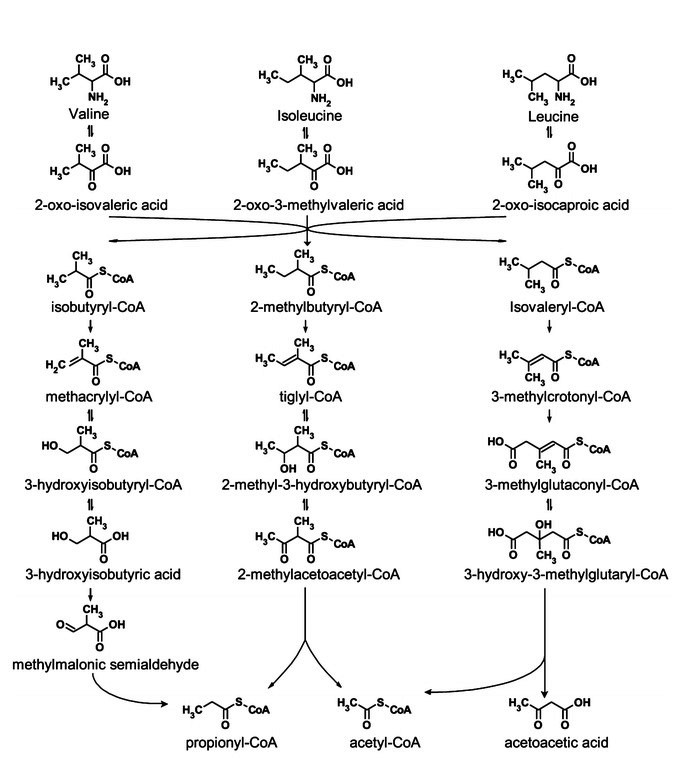
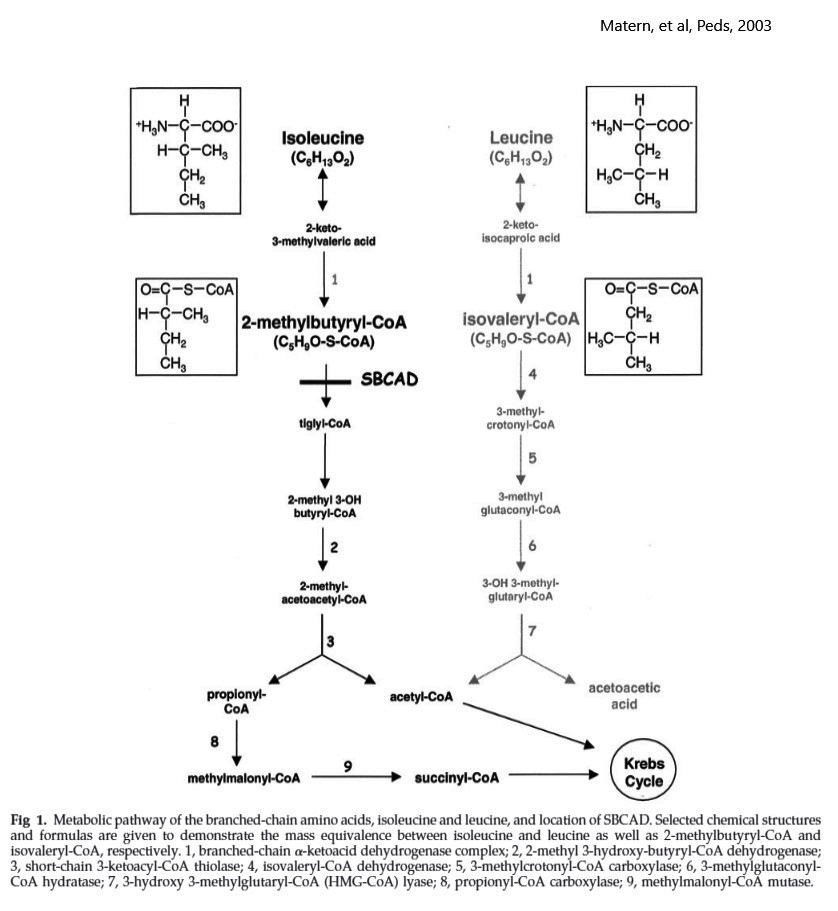
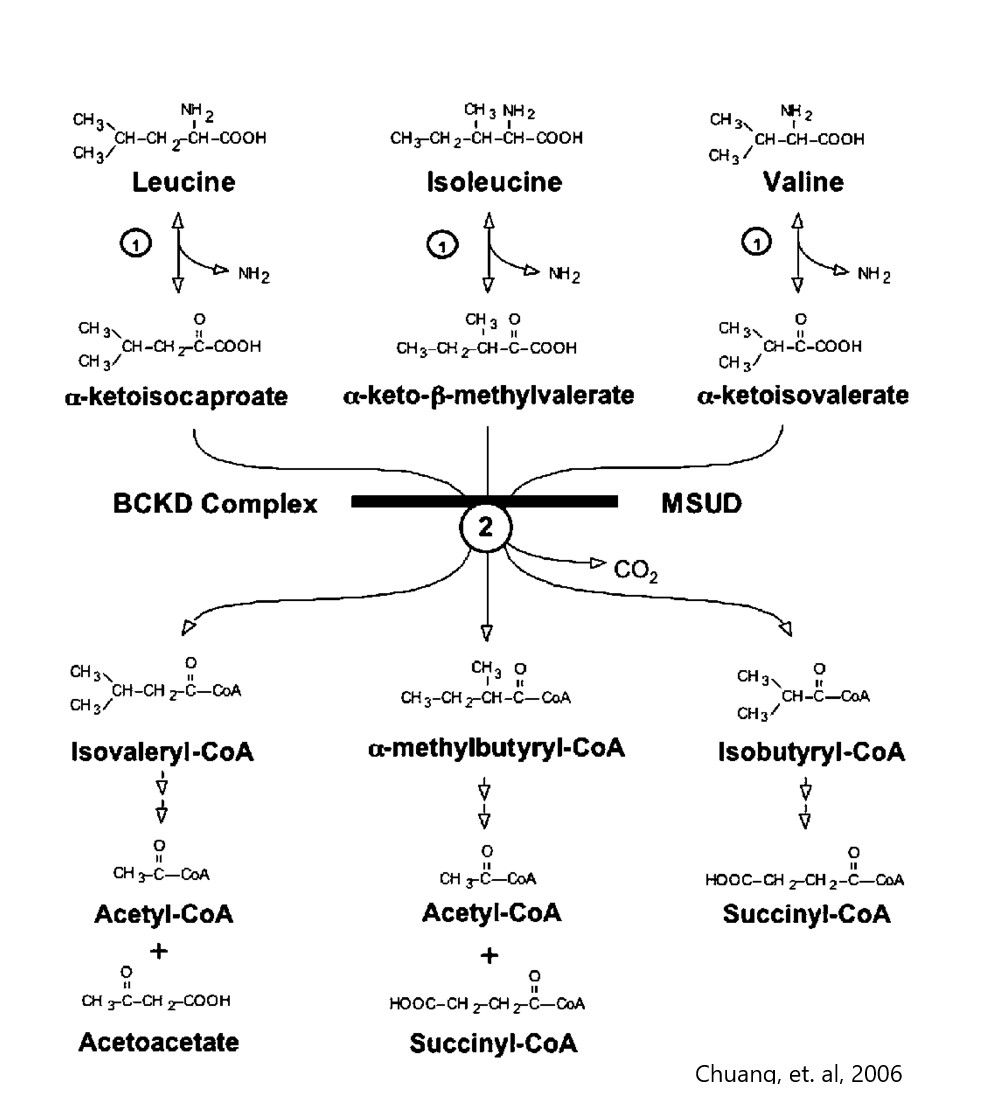
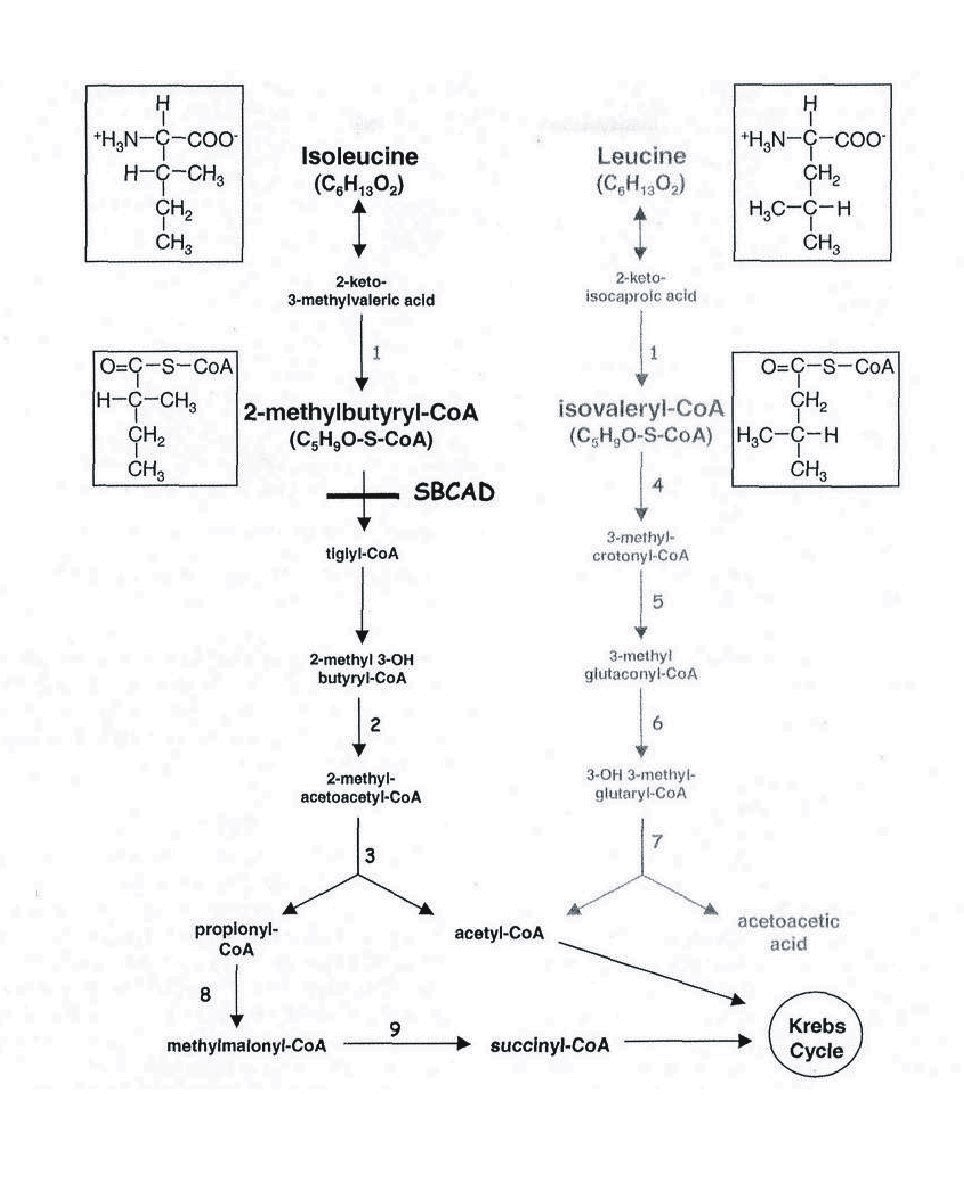
- Branched chain amino acids, metabolic fates
- Branched chain amino acids, matabolism structures
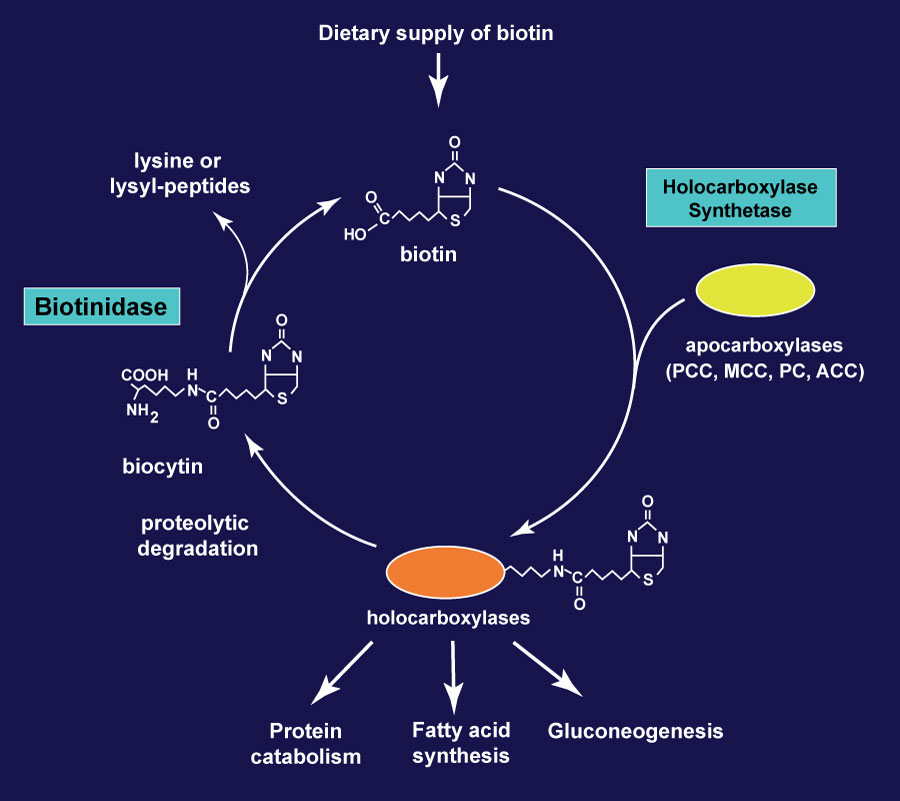
- Biotinidase
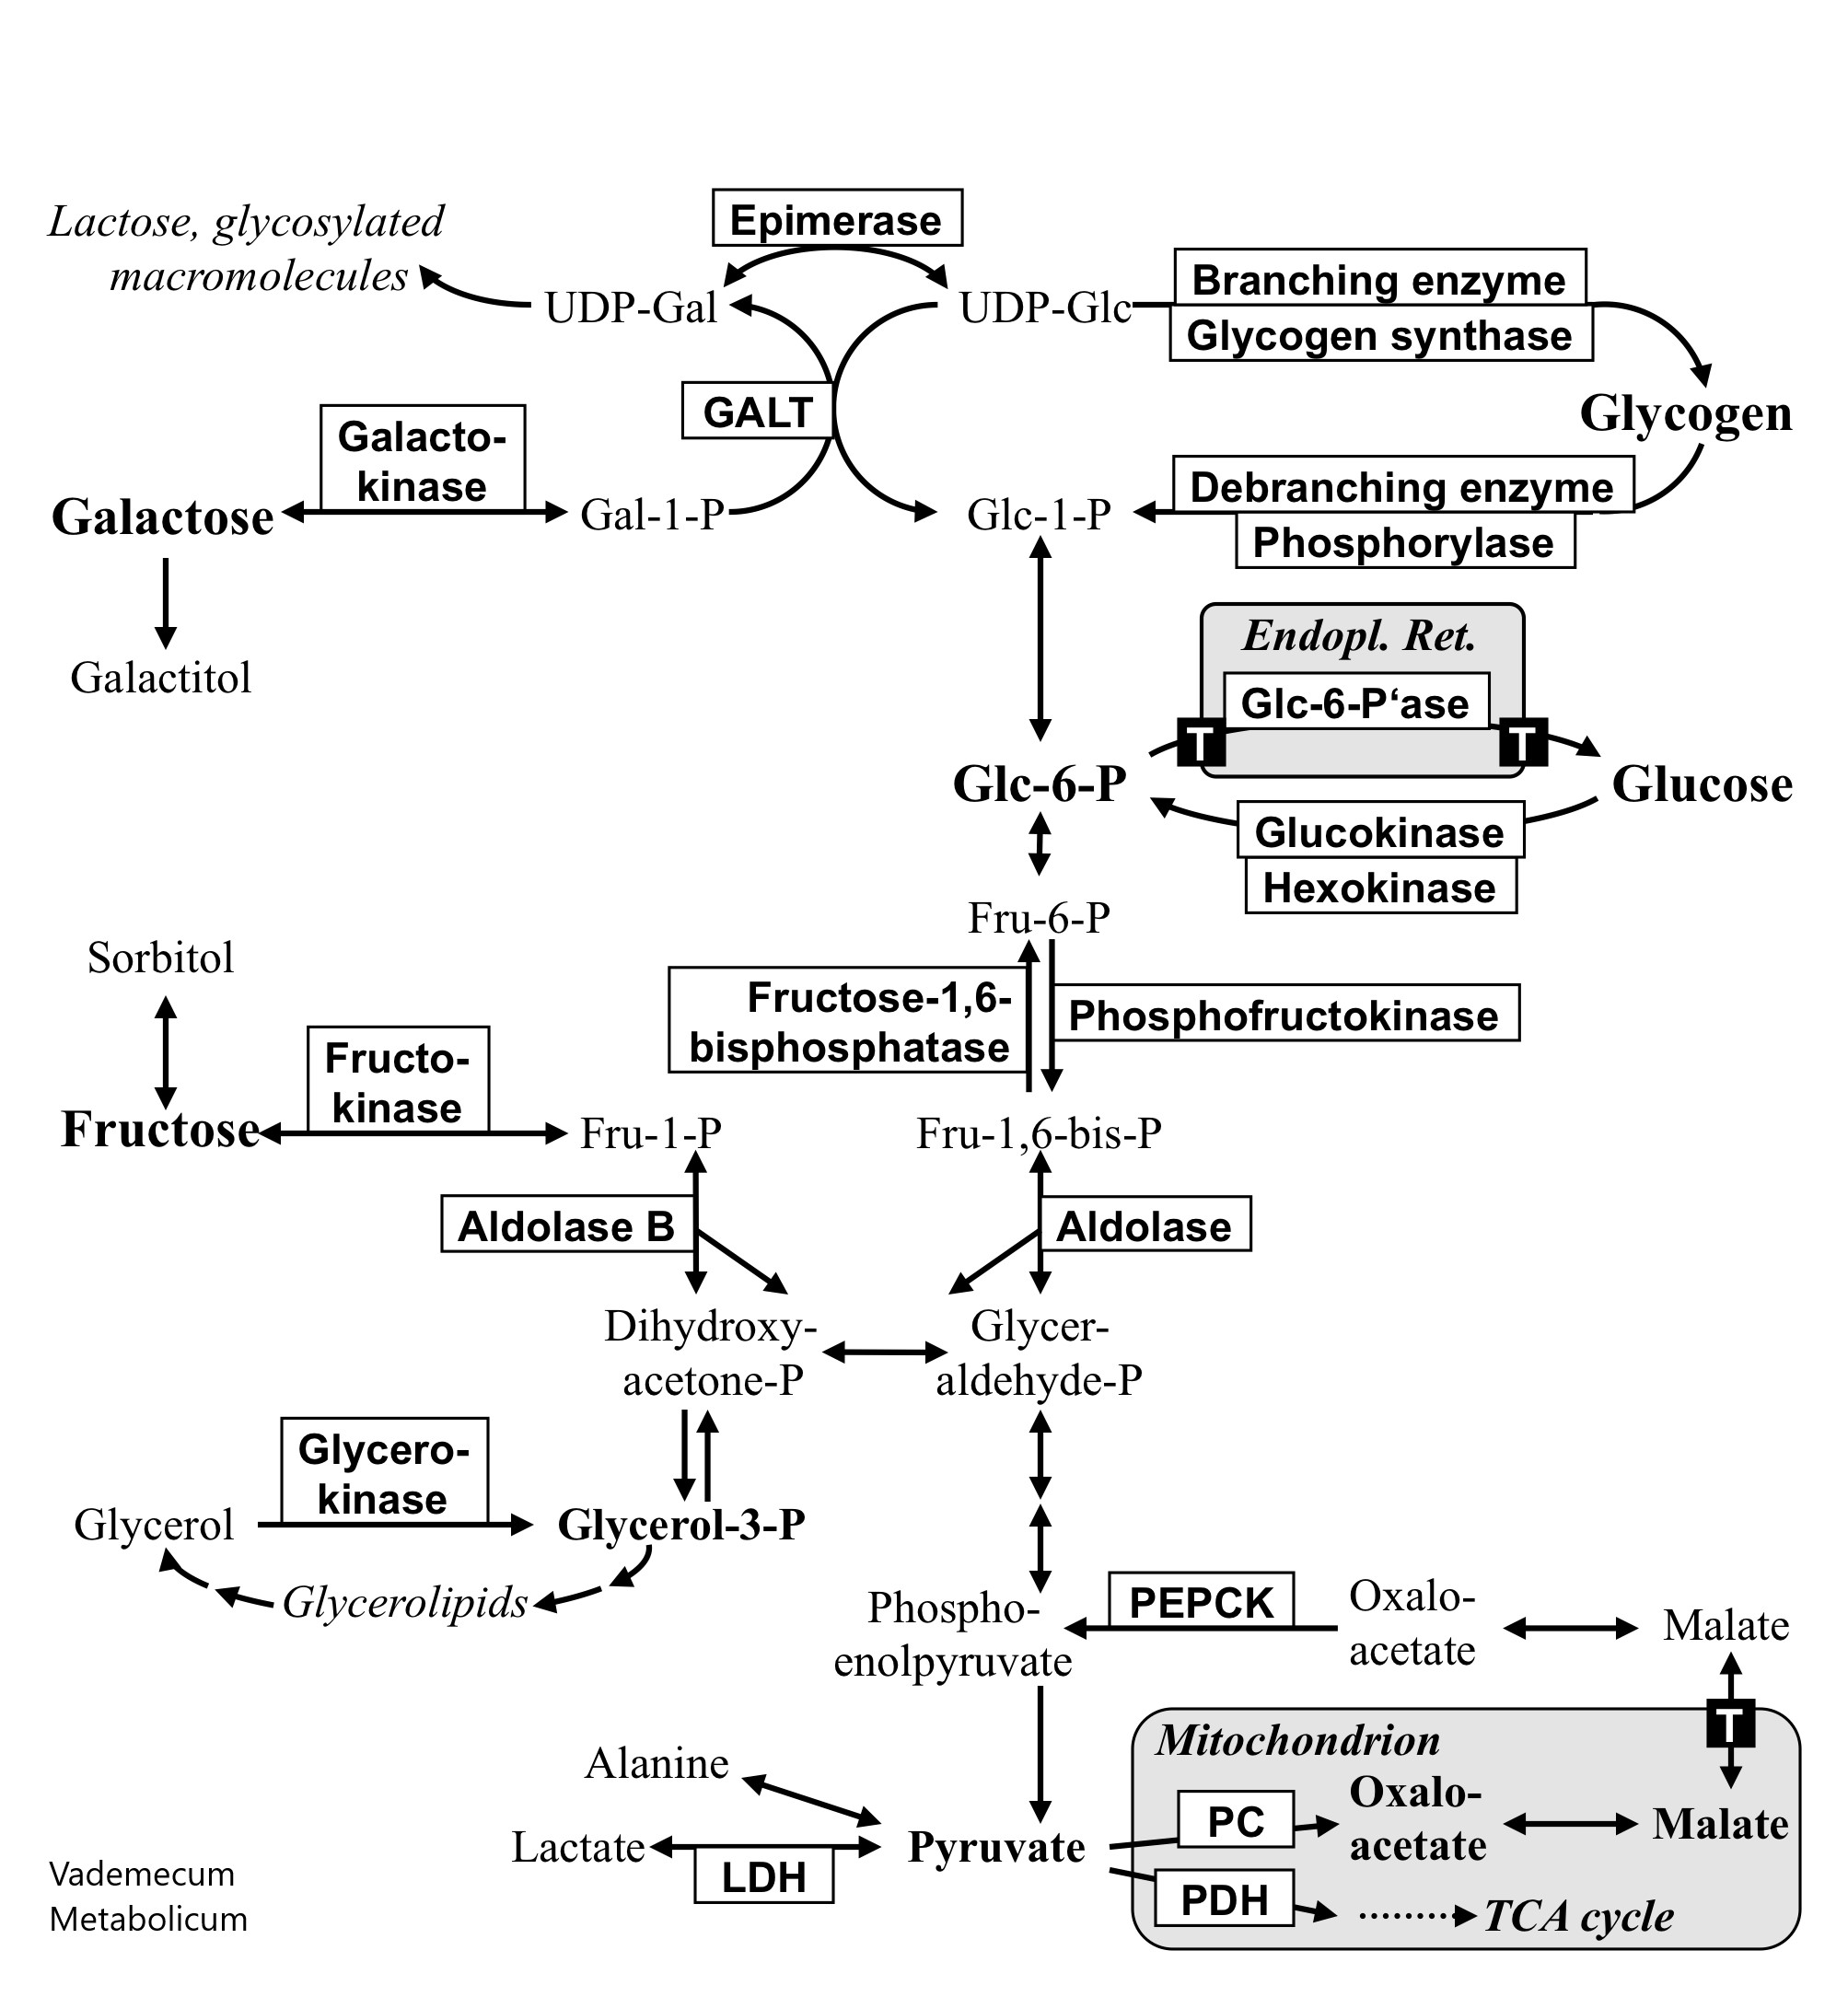
- Carbohydrate metabolism
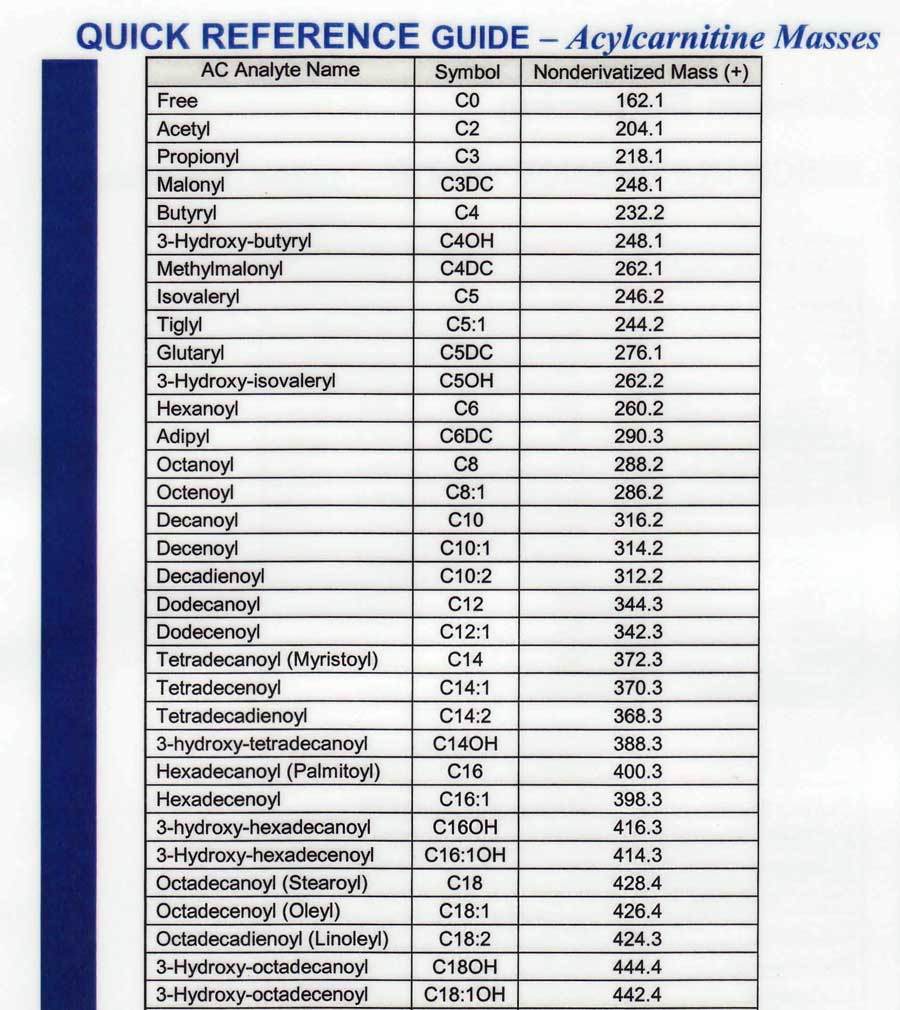
- C-numbering for MSMS
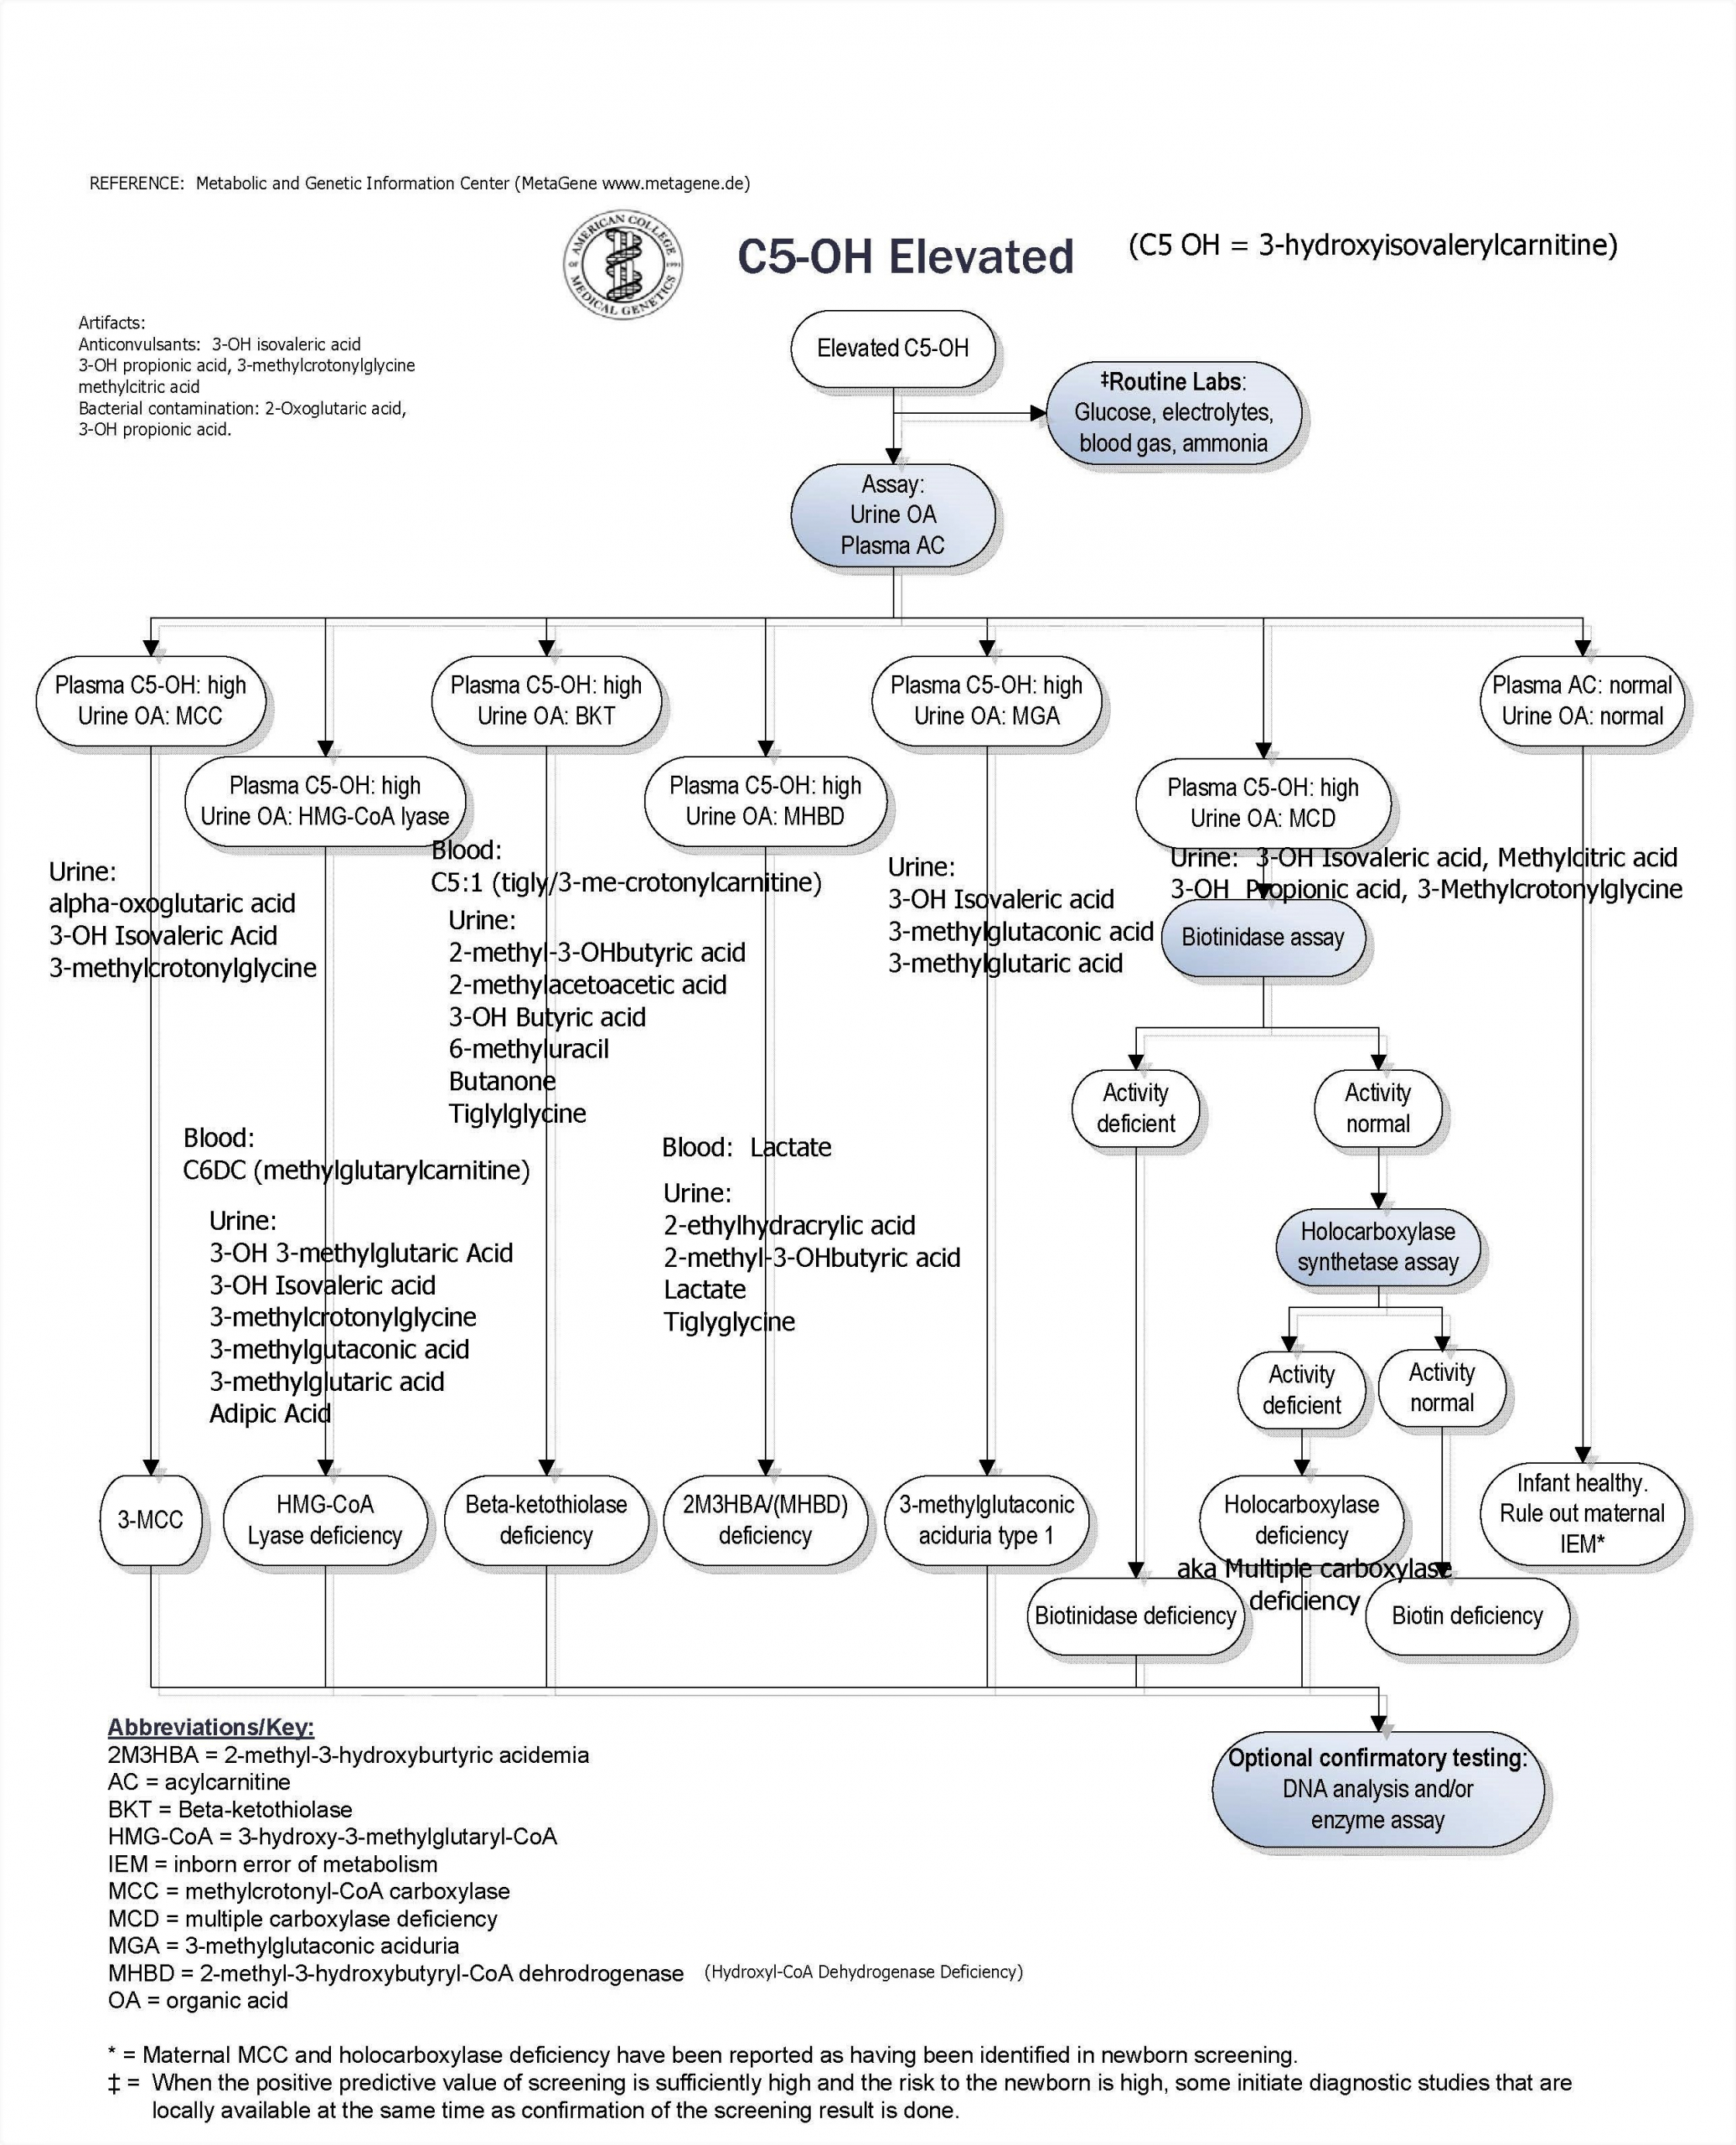
- C5OH UOA metabolites
- C-MSMS analytes
- CPT1, 2 and CACT
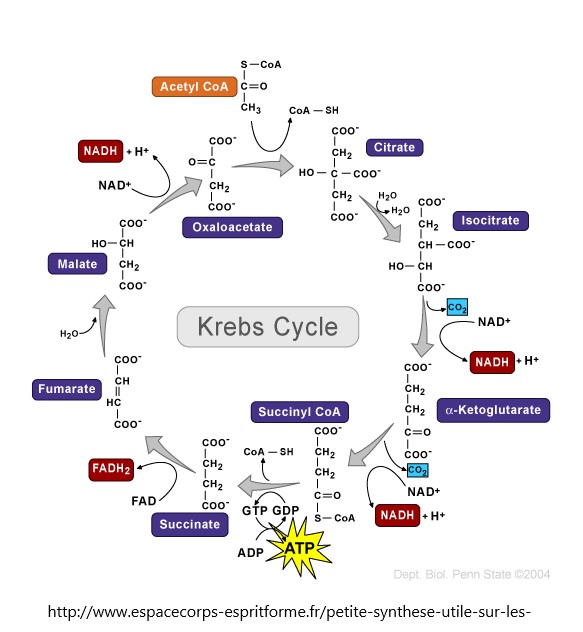
- Citric acid cycle
- Citric acid cycle simplified
- Creatine synthesis and transport
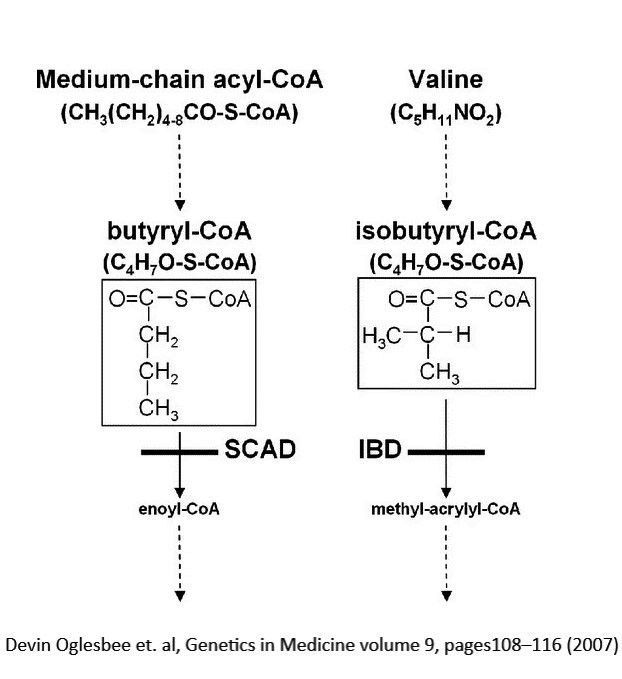
- Ethylmalonic, IBDH,SCAD algorithm
- Ethylmalonic acid pathway
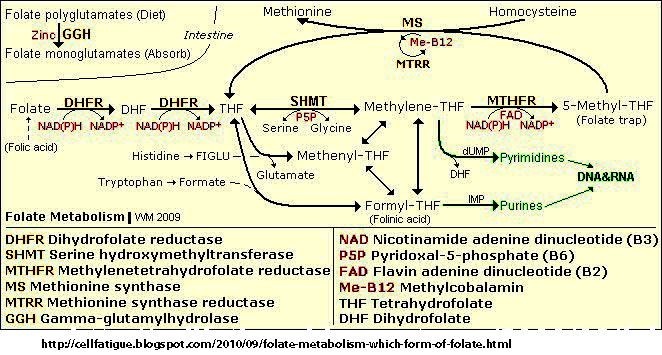
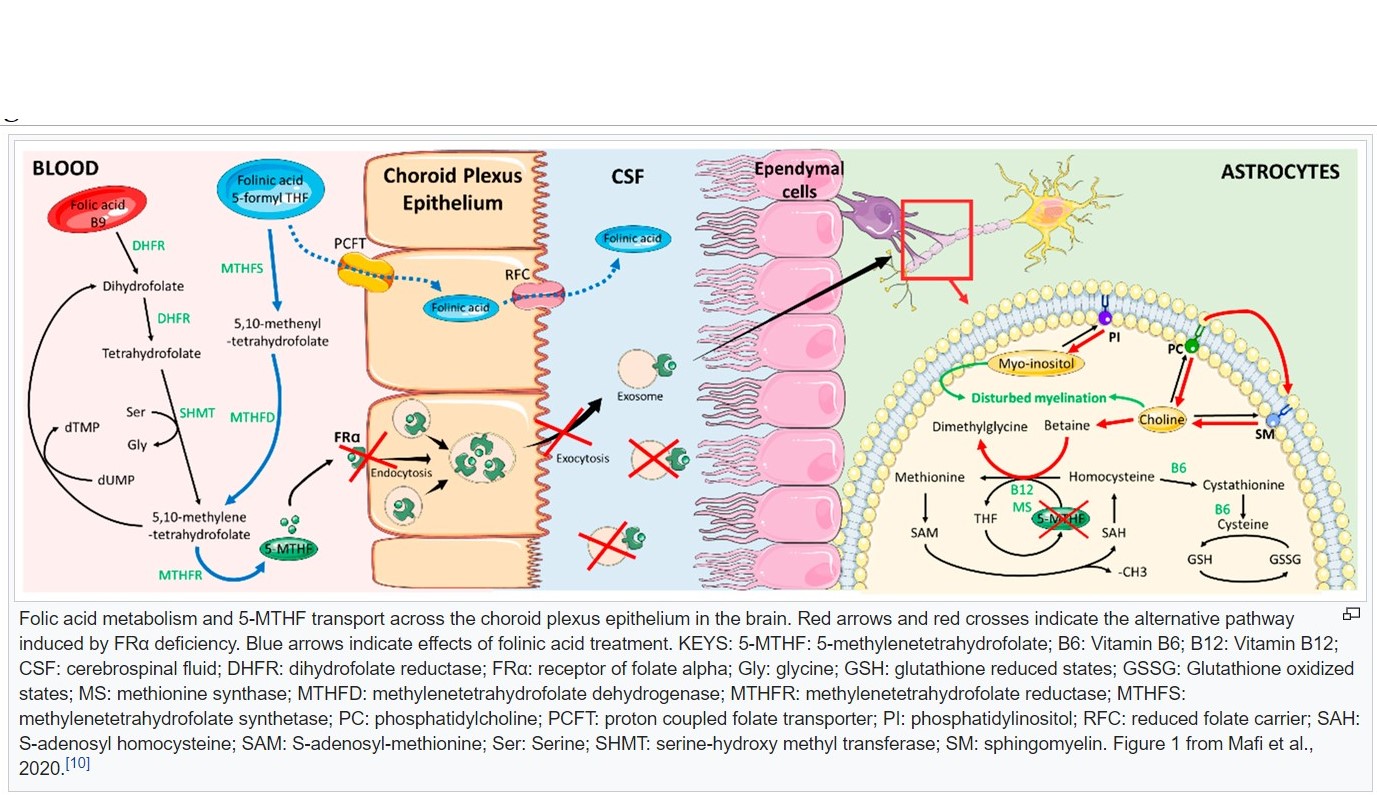
- Folate acid pathways
- Folate receptor, cerebral
- GABA SSADH
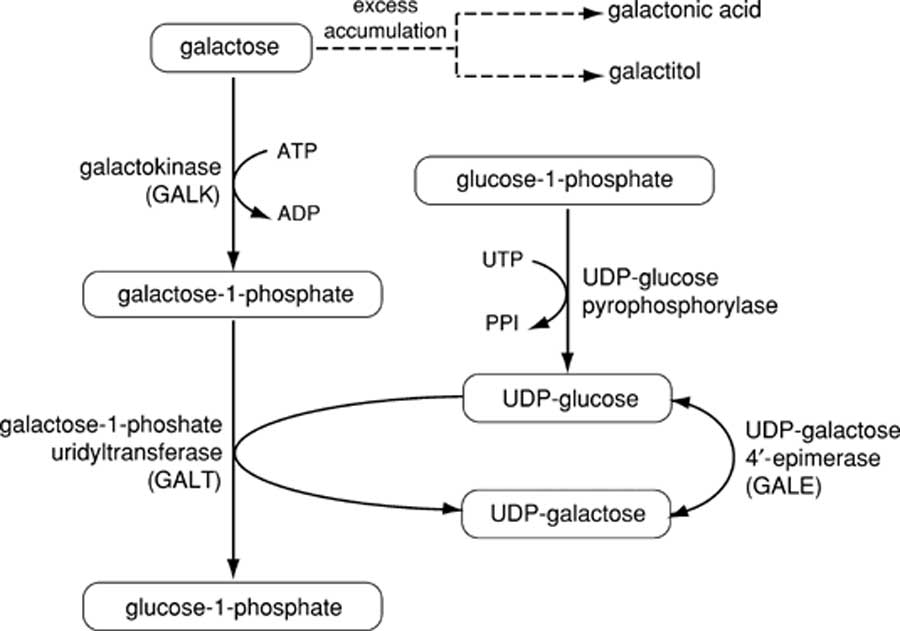
- Galactose pathway
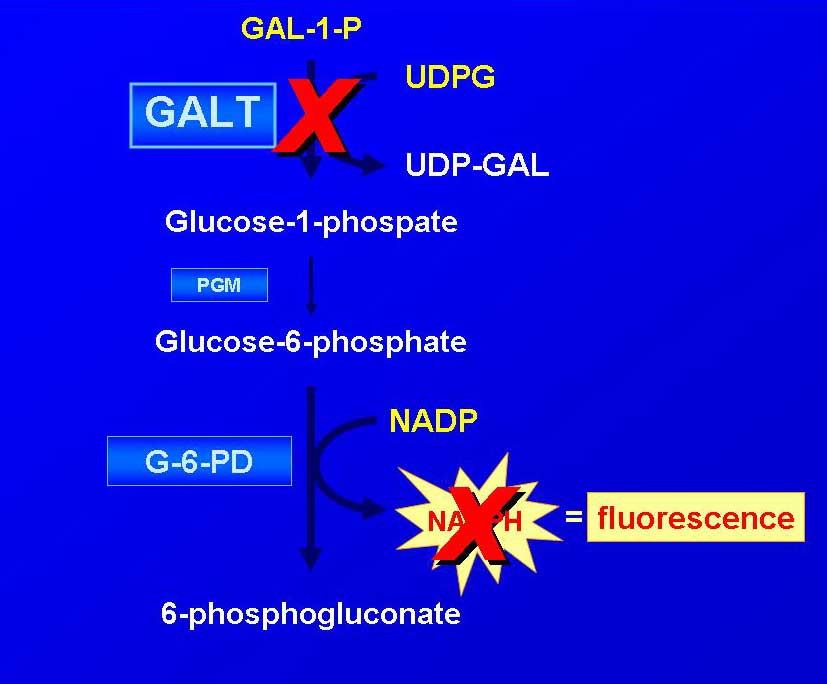
- Galactosemia florescence
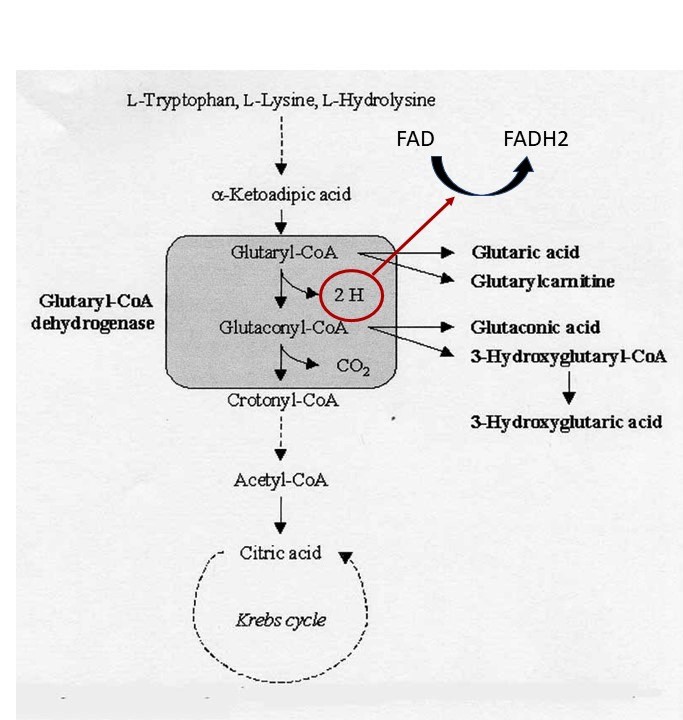
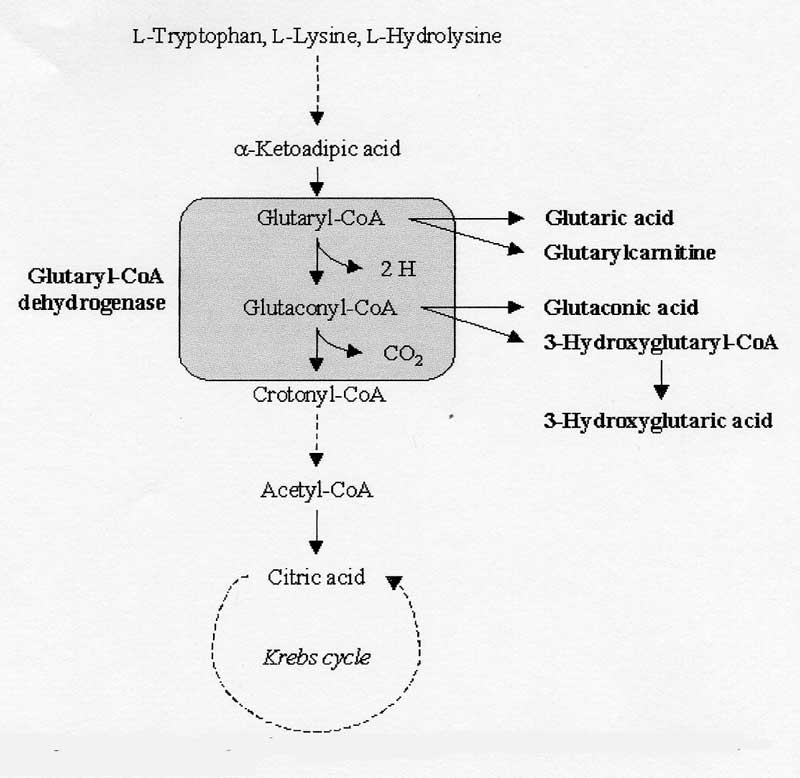
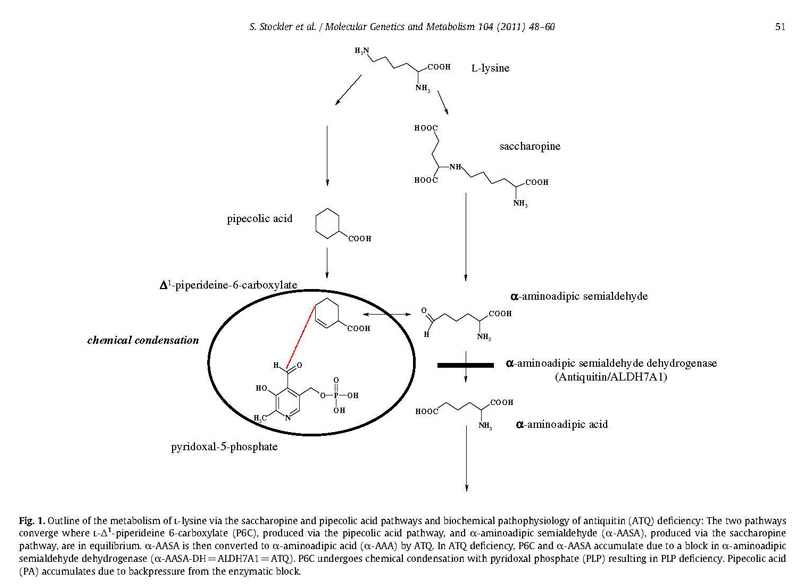
- Glutaric aciduria, type 1, lysine metabolism
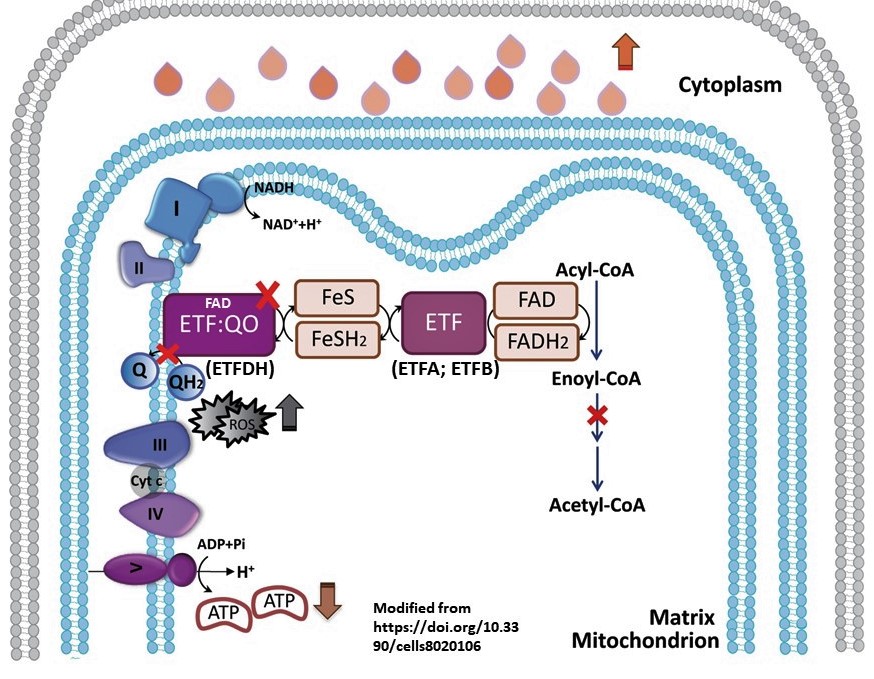
- Glutaric aciduria, type 2
- Glycine cleavage
- Glycine cleavage linear display
- Glycogen Storage Disease, types
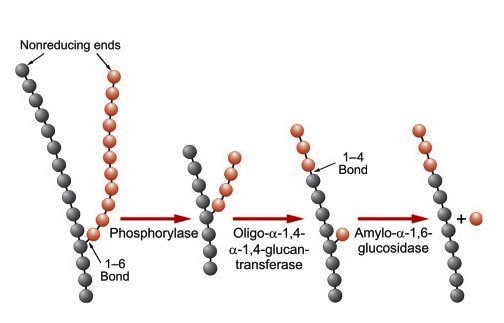
- Glycogen debranching
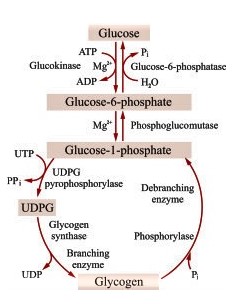
- Glycogen glucose kinase and phosphatase
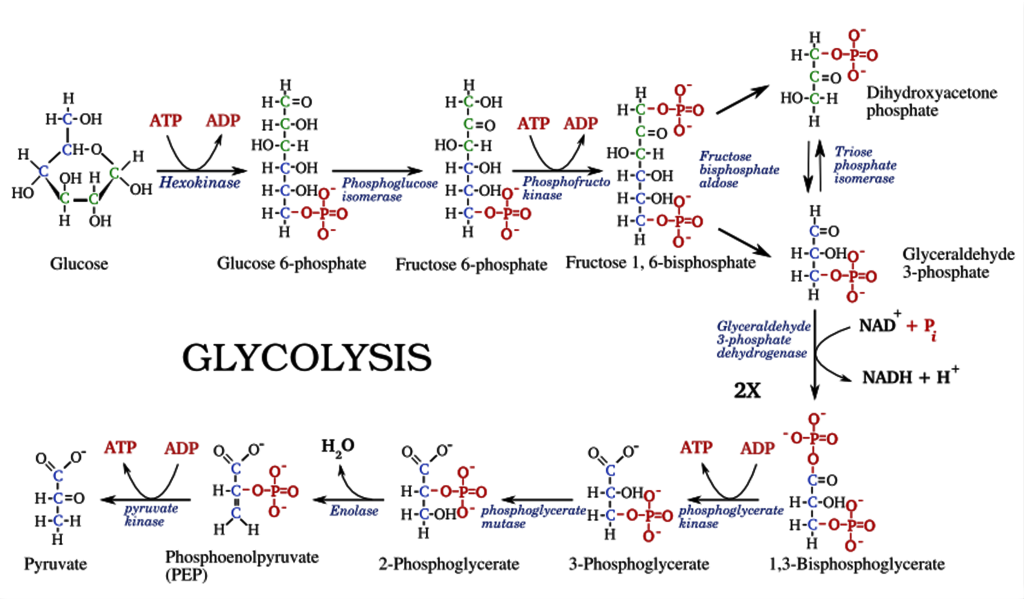
- Glycolysis
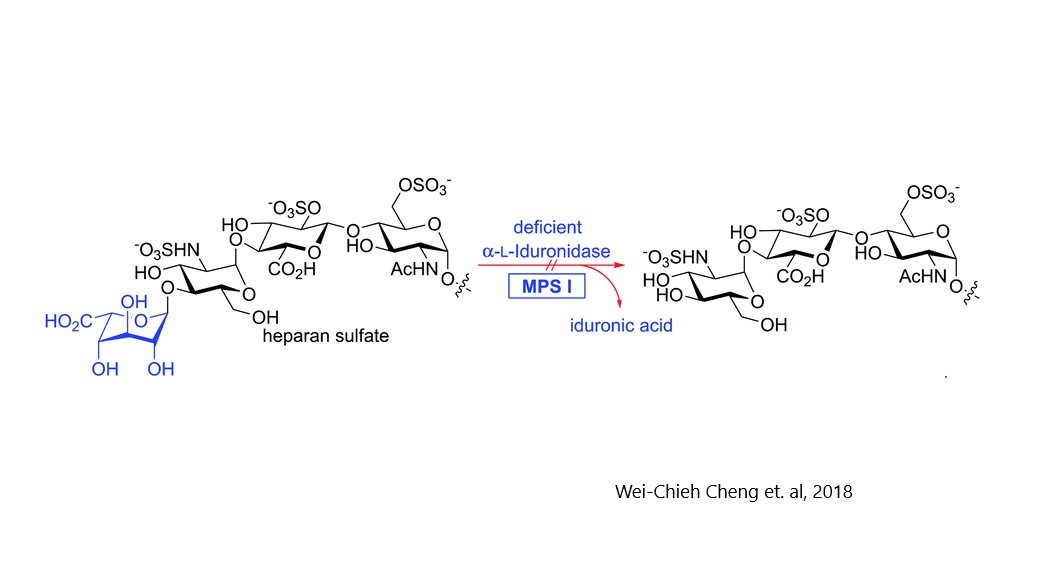
- Hurler MPS1
- Hurler GAGs table
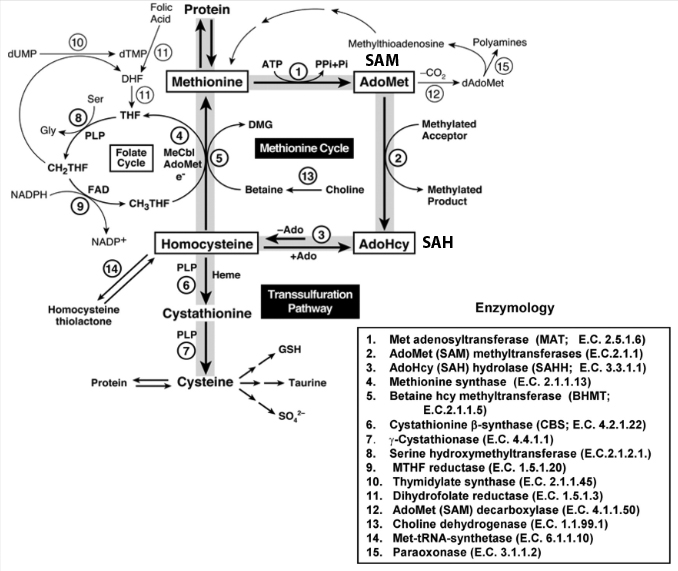
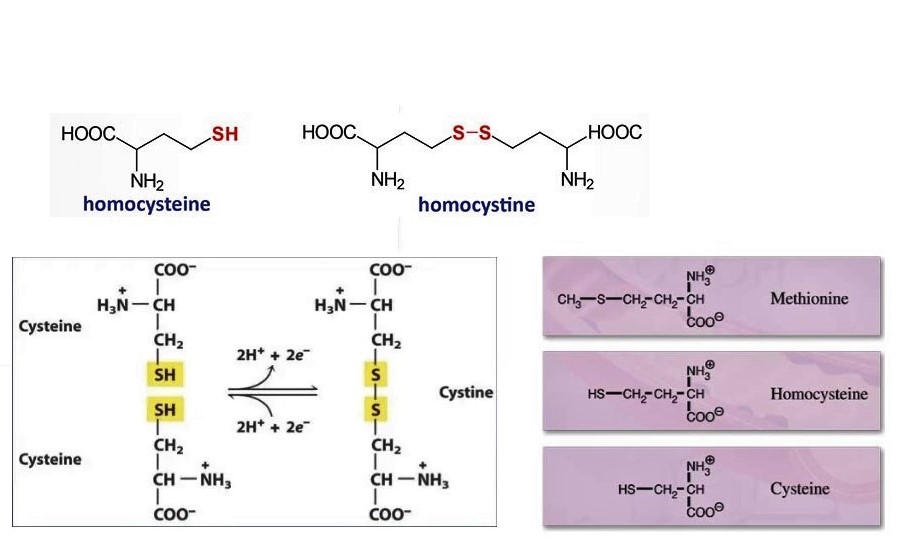
- Homocysteine, transsulfuration
- Homocysteine and homocystine
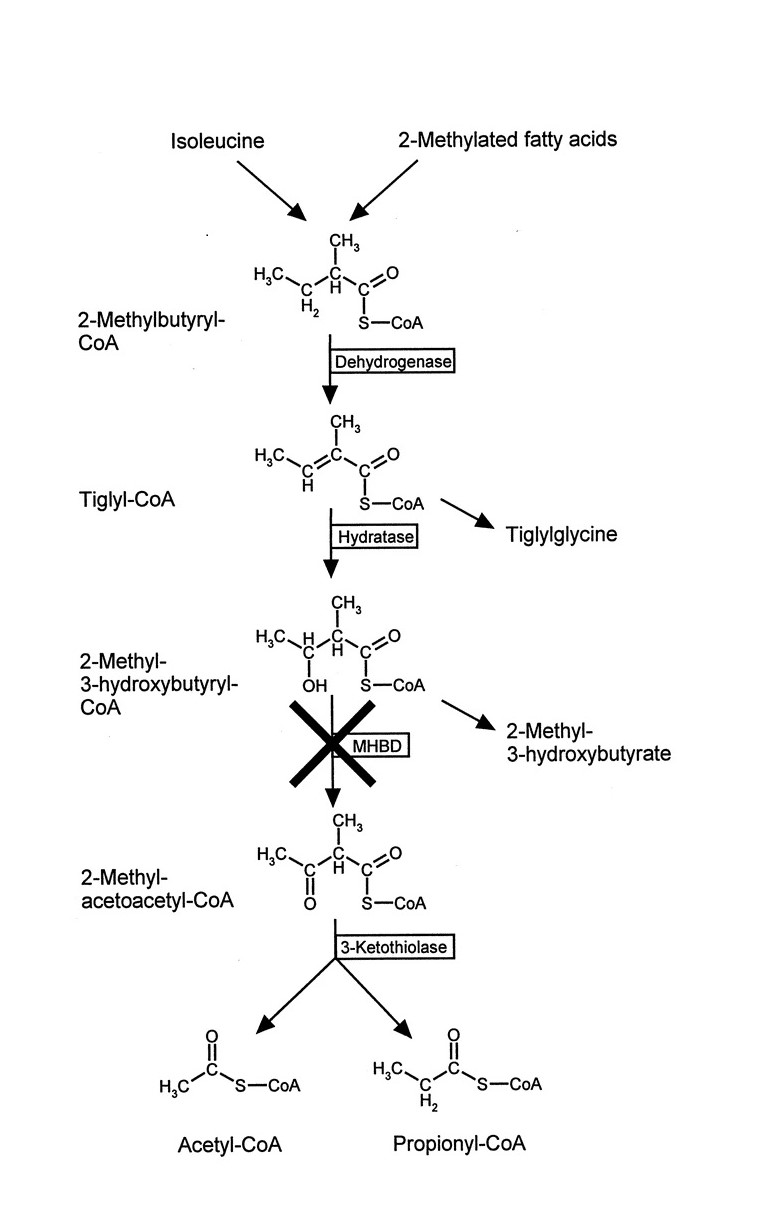
- Isoleucine (SBCAD) metabolism
- Keto-thiolase deficiency
- Keto-lysis
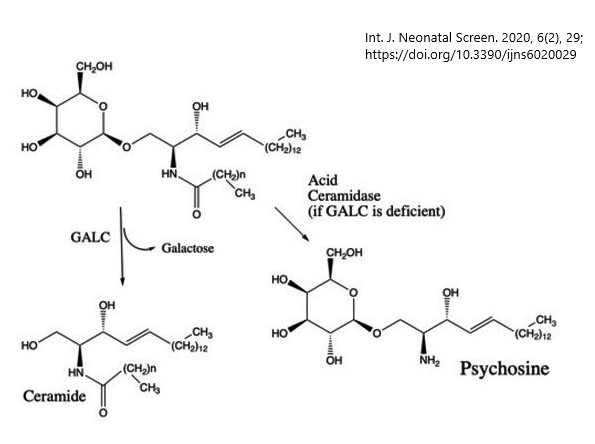
- Krabbe, psychosine
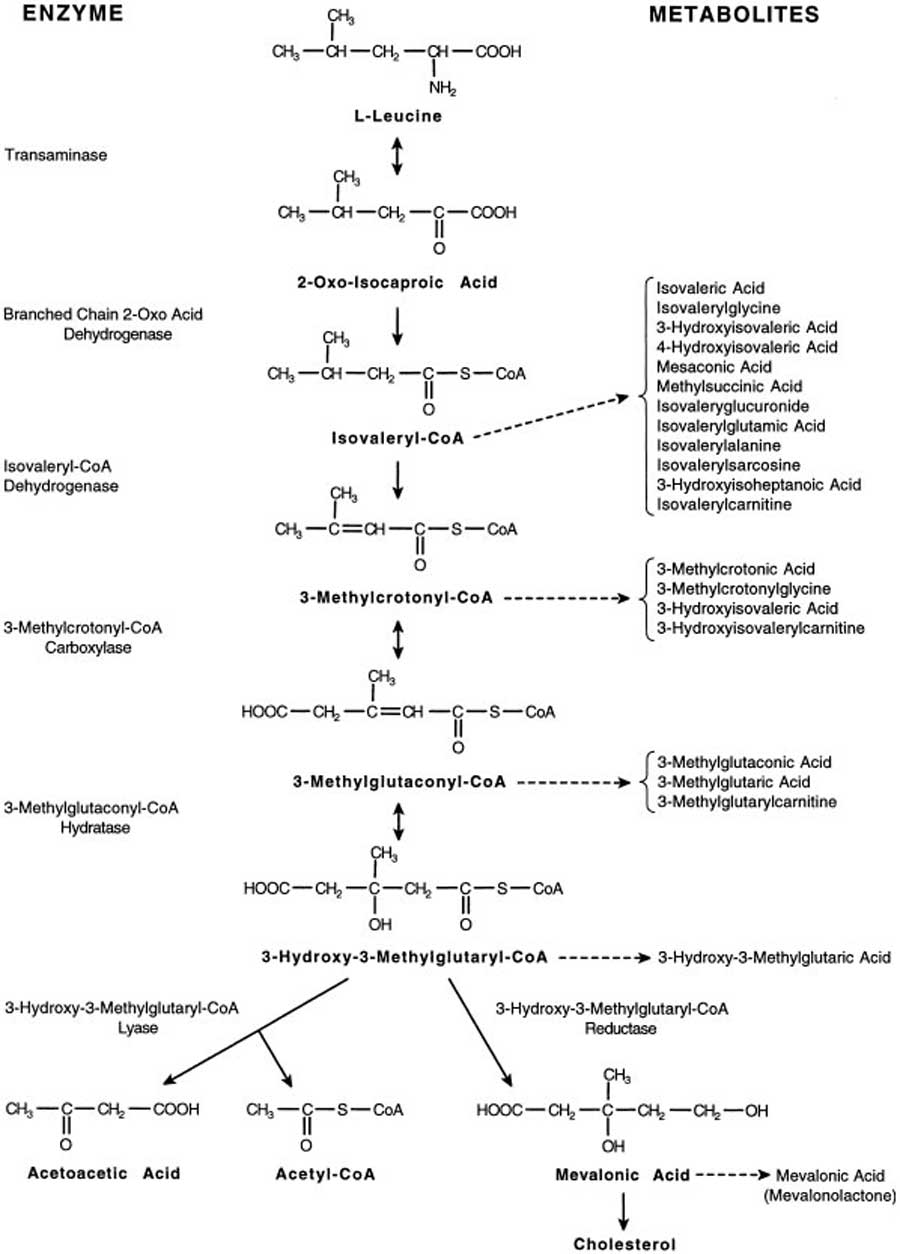
- Leucine metabolism
- Glutaric aciduria, type 1, lysine metabolism
- Malate and Aspartate shuttles
- Methionine pathway
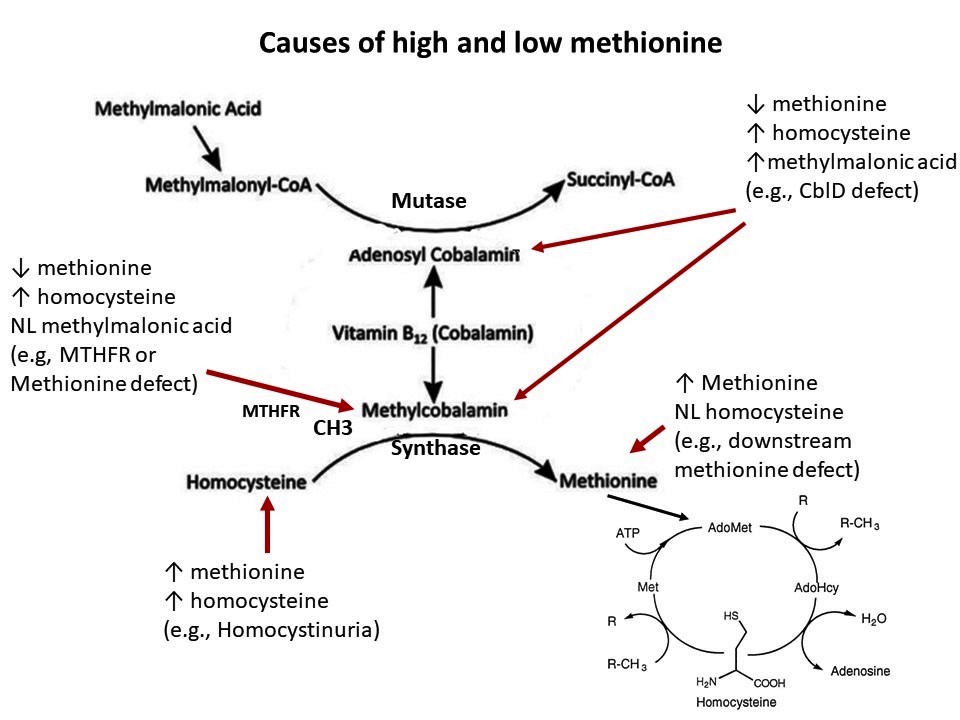
- Methionine: high and low
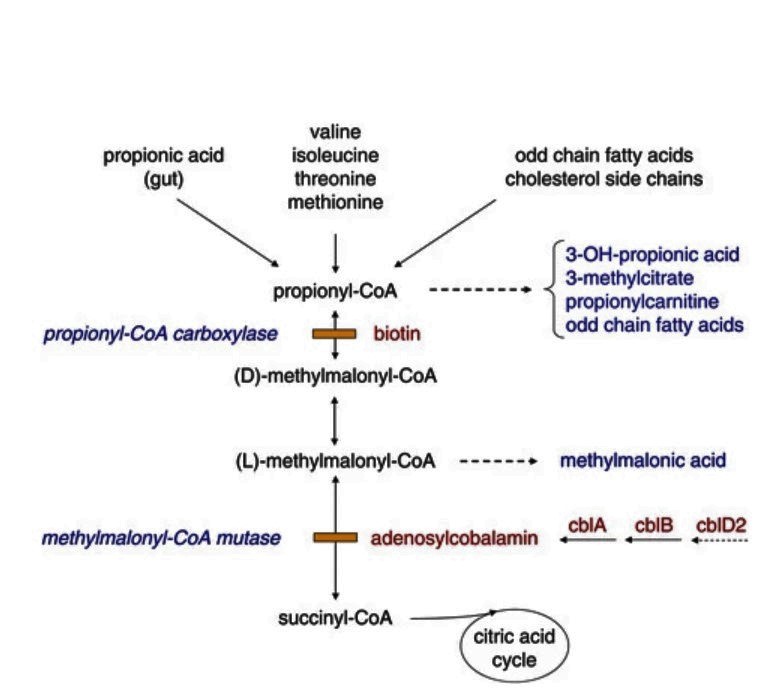
- Methylmalonic acid pathway
- MHBD deficiency
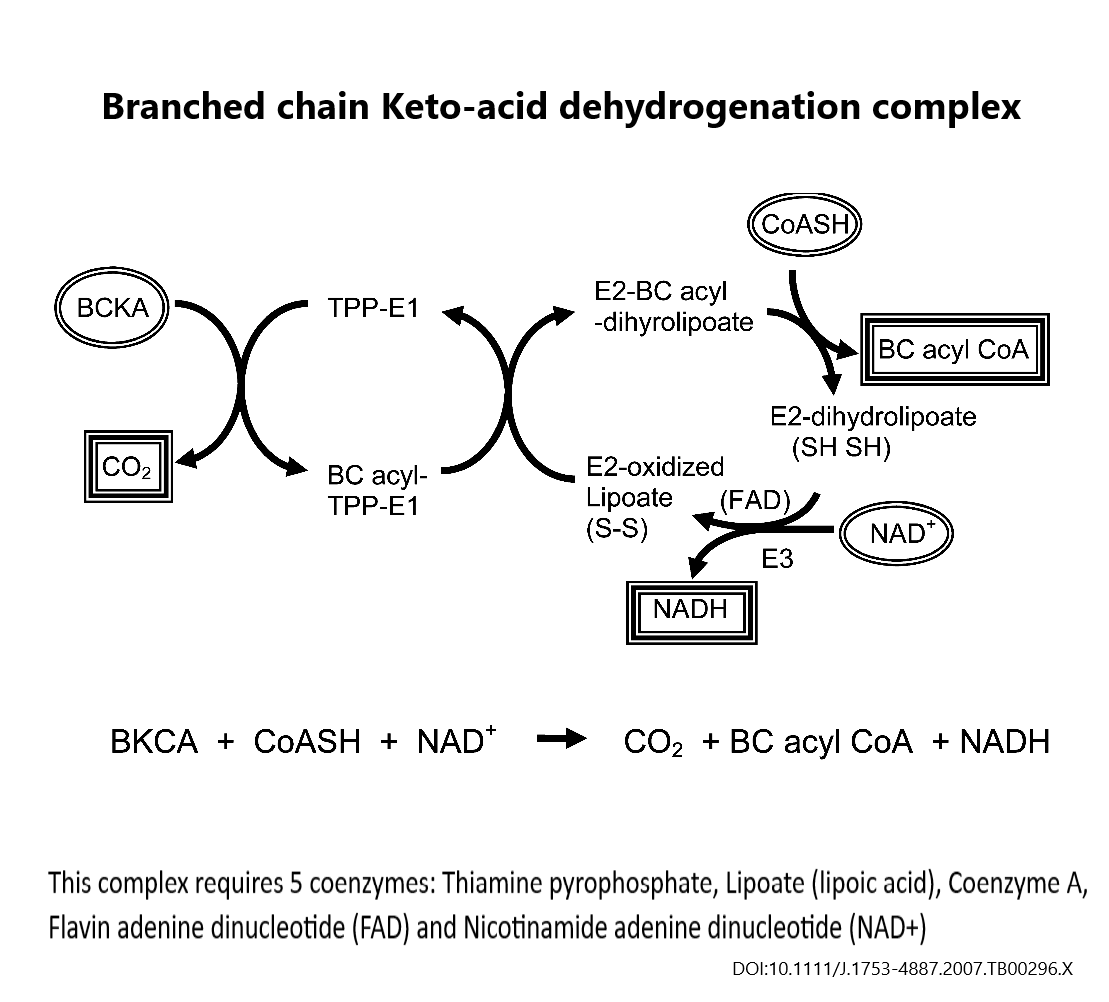
- MSUD, Branched chain keto-acid dehydro complex
- MSUD downstream Acyl-CoAs
- Neurotransmitters in CSF
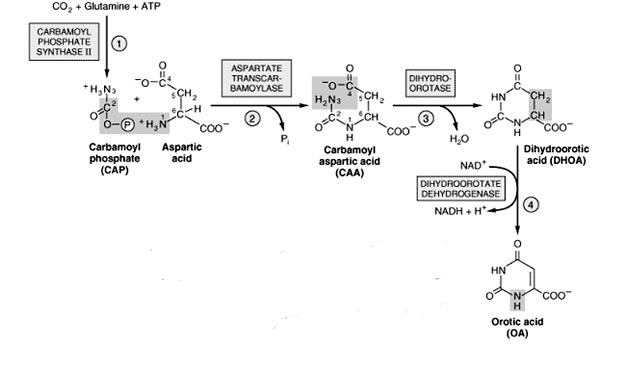
- Orotic Acid
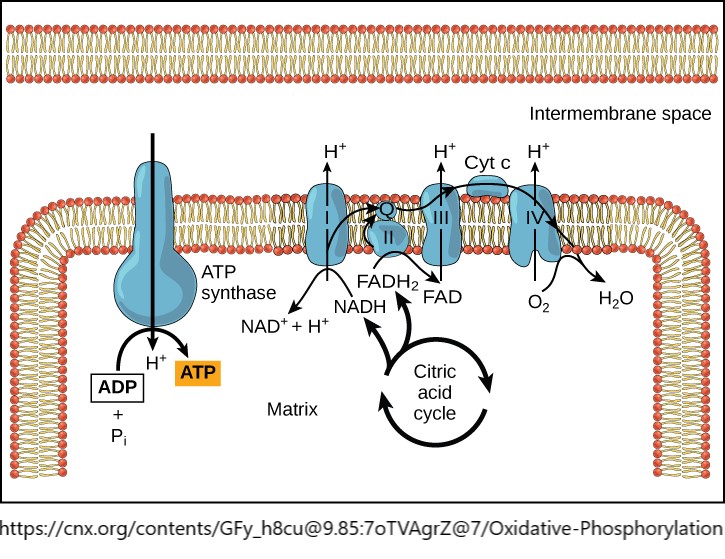
- Oxidative phosphorylation, mito
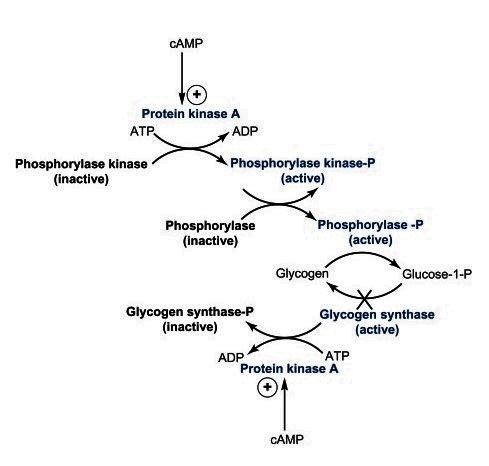
- Phosphorylase
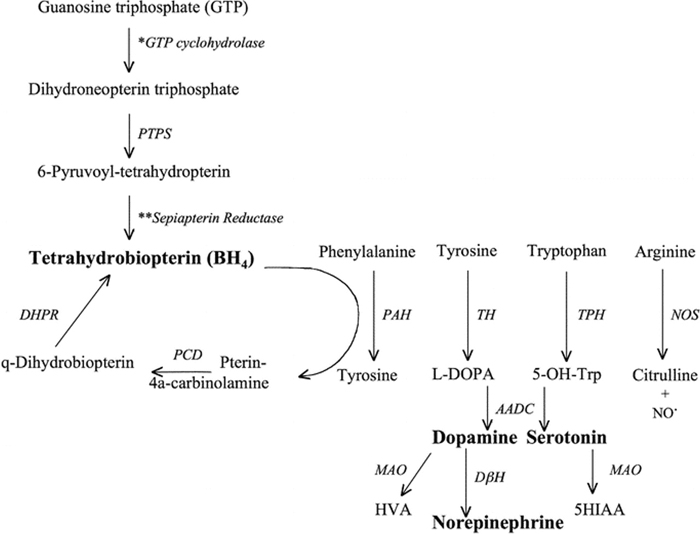
- PKU-biopterin
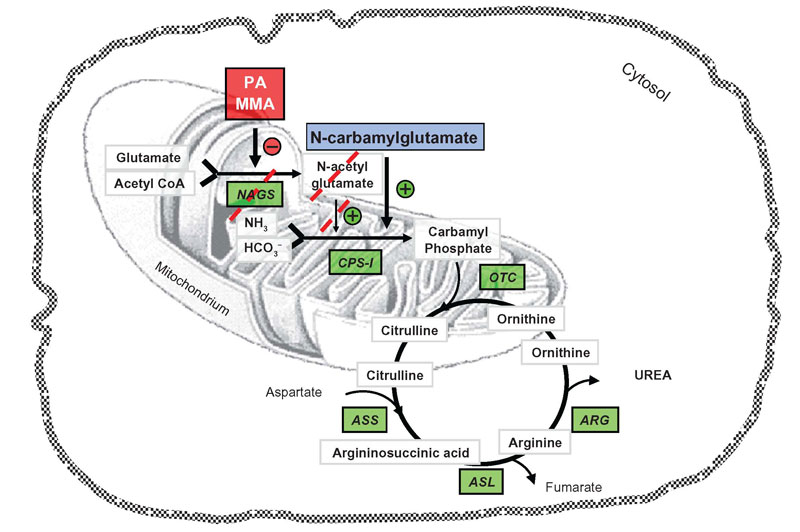
- Propionic Carglumic acid
- Propionic acid pathway
- Pyridoxine deficiency
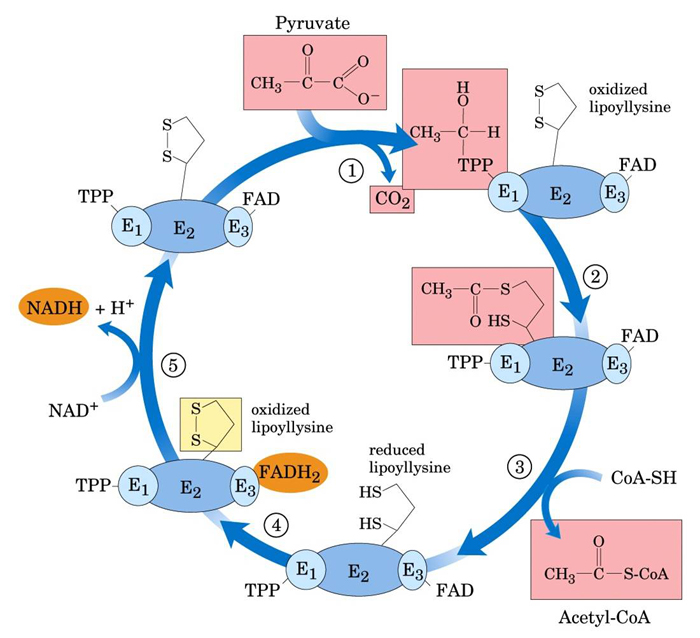
- Pyruvate Dehydrogenase Complex
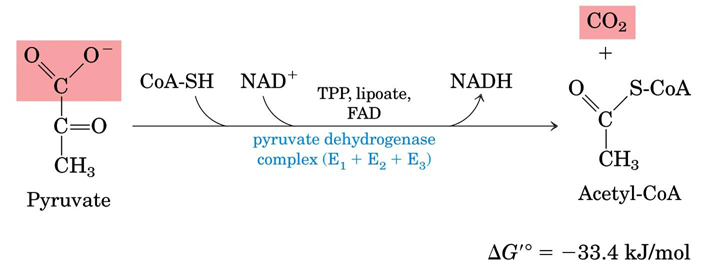
- Pyruvate Dehydrogenase complex simplified
- Pyruvate Carboxylase
- SCAD, IBDH
- SBCAD
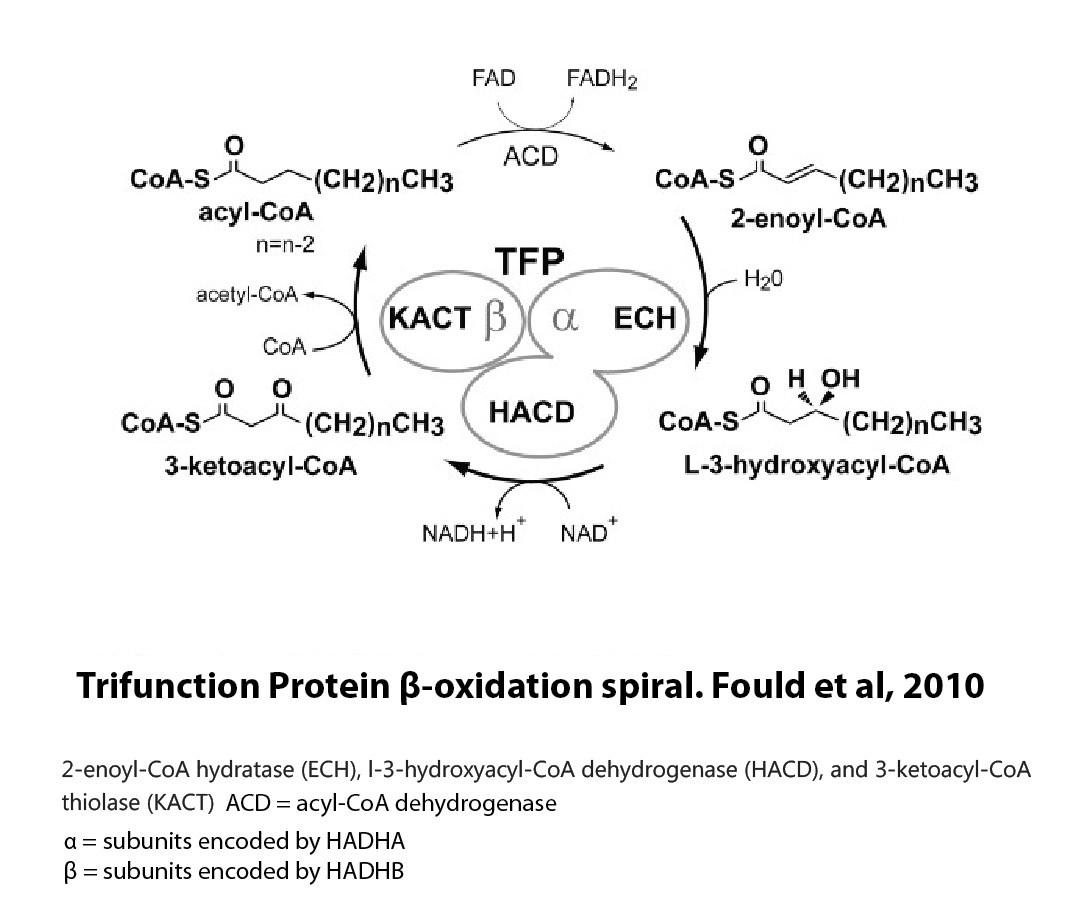
- Trifunctional protein
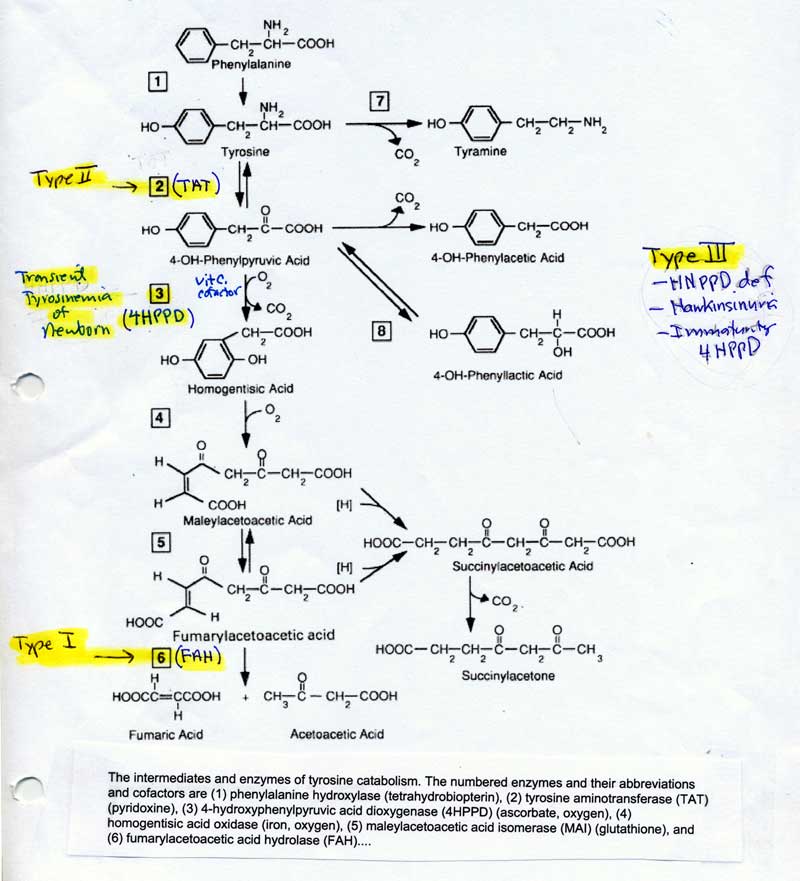
- Tyrosinemia I, II and III
- Urea cycle scavengers
- Urea cycle NAGS and transporters
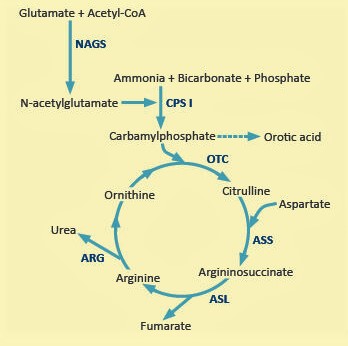
- Urea cycle simplified
- Urea cycle structures